Reading. Hill, Griffiths & Lim (5th ed.), sec. 6.1–6.2; Stock & Watson (4th ed.), sec. 7.2.
The \(t\)-test we have used so far handles a single restriction — one “equals” sign, even one that spans several coefficients. But many of the questions we actually want to ask are joint: they impose two or more restrictions at once. Does advertising matter at all — is \(\beta_3 = 0\)and\(\beta_4 = 0\) in Big Andy’s quadratic sales model? Does a whole group of variables (socioeconomic controls, prices of substitutes) belong? Does the model explain anything — are all the slopes zero? Each of these has several equals signs, and a \(t\)-test cannot do them. Testing one restriction at a time is unreliable. The tool for the job is the \(F\)-test.
This chapter builds the \(F\)-test from the idea of comparing two nested models — one with the restrictions imposed and one without. We use it to test overall model significance, work out exactly when the \(t\)- and \(F\)-tests agree, and finally turn it loose on economic restrictions like constant returns to scale. It builds directly on the multiple-regression machinery and single-coefficient tests of multiple-regression hypothesis testing.
17.1 Why a new test?
A joint hypothesis imposes \(J \ge 2\) restrictions simultaneously. A typical example in Big Andy’s model is \[
H_0:\ \beta_3 = 0 \ \text{ and } \ \beta_4 = 0
\qquad\text{vs.}\qquad
H_1:\ \beta_3 \neq 0 \ \text{ or } \ \beta_4 \neq 0 .
\] Notice the asymmetry: the null requires both coefficients to be zero, while the alternative needs only one of them to be nonzero.
The natural temptation is to just run two separate \(t\)-tests, one for each coefficient, and combine the verdicts. This is a trap.
Why two t-tests are not a joint test
Error rates compound. Two separate \(5\%\) tests do not deliver a \(5\%\) joint test. The chance of some false rejection across the two is larger than \(5\%\), so the combined procedure has the wrong size.
It misreads correlated regressors. When two regressors are collinear, each individual \(t\) can come out insignificant while the pair is jointly decisive. A one-at-a-time procedure would wrongly drop both, throwing away variables that genuinely belong.
We need a test that weighs all the restrictions together, in a single statistic with a single \(p\)-value. That is the \(F\)-test.
17.2 The F-statistic: restricted vs. unrestricted
The \(F\)-test compares the fit of two nested models: an unrestricted (full) model, and a restricted model obtained by imposing \(H_0\).
Two models, with and without the restrictions
Take Big Andy’s quadratic sales model. The unrestricted model is the full specification, \[
\text{SALES} = \beta_1 + \beta_2\text{PRICE} + \beta_3\text{ADVERT}
+ \beta_4\text{ADVERT}^2 + e ,
\] with sum of squared errors \(\mathrm{SSE}_U\). The restricted model imposes \(H_0:\beta_3 = \beta_4 = 0\), dropping both advertising terms, \[
\text{SALES} = \beta_1 + \beta_2\text{PRICE} + e ,
\] with sum of squared errors \(\mathrm{SSE}_R\).
Dropping variables can only worsen the fit — OLS on the full model is free to set those coefficients to zero if that is best, so allowing them to be nonzero can never increase the squared-error total. Hence \[
\mathrm{SSE}_R \ge \mathrm{SSE}_U \quad\text{always.}
\] The whole question is whether the increase in SSE from imposing \(H_0\) is large or small. A large increase means the restrictions hurt the fit a lot — the dropped variables mattered — so we reject\(H_0\). A small increase means the restrictions were nearly harmless, and we do not reject.
The \(F\)-statistic turns “how big is the increase?” into a number with a known distribution.
The F-statistic
\[
F = \frac{(\mathrm{SSE}_R - \mathrm{SSE}_U)/J}{\mathrm{SSE}_U/(N-K)}
\;\sim\; F_{(J,\,N-K)} \quad\text{under } H_0 ,
\] where \(J\) is the number of restrictions (the numerator degrees of freedom) and \(N-K\) is the unrestricted model’s degrees of freedom (the denominator degrees of freedom).
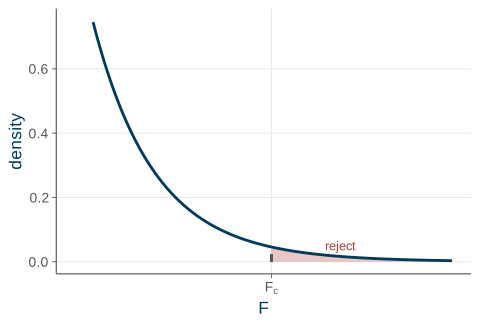
Reading the pieces: the numerator is the extra error caused by imposing \(H_0\), expressed per restriction. The denominator is the model’s own noise, \(\hat\sigma^2 = \mathrm{SSE}_U/(N-K)\). So \(F\) measures the cost of the restrictions relative to the model’s underlying variability. A large\(F\) means the restrictions cost a lot relative to noise, and we reject\(H_0\) when \(F \ge F_c\), the critical value. Because only large values count against \(H_0\), the \(F\)-test is always a right-tailed test (Figure 17.1).
Code
xs<-seq(0.001, 6, length.out =400)df1<-2; df2<-71Fc<-qf(0.95, df1, df2)dat<-data.frame(x =xs, y =df(xs, df1, df2))sh<-subset(dat, x>=Fc)ggplot(dat, aes(x, y))+geom_area(data =sh, aes(x, y), fill =ucla$red, alpha =0.30)+geom_line(color =ucla$darkblue, linewidth =1)+geom_segment(aes(x =Fc, xend =Fc, y =0, yend =df(Fc, df1, df2)), linetype ="dashed", color =ucla$gray)+annotate("text", x =Fc+1.1, y =0.05, label ="reject", color =ucla$red, size =3.4)+scale_x_continuous(breaks =Fc, labels =expression(F[c]))+scale_y_continuous(limits =c(0, 0.75))+labs(x ="F", y ="density")
Figure 17.1: The F-distribution. We reject \(H_0\) for large \(F\), in the right tail beyond the critical value \(F_c\).
Big Andy’s: does advertising matter?
Put the test to work. We test \(H_0:\beta_3 = 0,\ \beta_4 = 0\) — advertising, both its linear and quadratic terms, is irrelevant — against “at least one nonzero.” Here \(J = 2\) restrictions, \(N = 75\) observations, and \(K = 4\) coefficients in the full model. The two sums of squared errors are \[
\mathrm{SSE}_U = 1532.08, \qquad \mathrm{SSE}_R = 1896.39 ,
\] so the statistic is \[
F = \frac{(1896.39 - 1532.08)/2}{1532.08/(75-4)} = 8.44 .
\] The \(5\%\) critical value is \(F_{(0.95,\,2,\,71)} = 3.13\), and the \(p\)-value is \(0.0005\). Since \(8.44 > 3.13\) we reject \(H_0\): advertising does affect sales. Crucially, we could not have learned this cleanly from the two separate \(t\)’s, because ADVERT and ADVERT\(^2\) are collinear — exactly the situation the joint test is built for.
In R, the entire calculation is one anova() call comparing the restricted and unrestricted fits.
data(andy)unrestricted<-lm(sales~price+advert+I(advert^2), data =andy)restricted<-lm(sales~price, data =andy)anova(restricted, unrestricted)#> Analysis of Variance Table#> #> Model 1: sales ~ price#> Model 2: sales ~ price + advert + I(advert^2)#> Res.Df RSS Df Sum of Sq F Pr(>F) #> 1 73 1896.4 #> 2 71 1532.1 2 364.31 8.4414 0.0005142 ***#> ---#> Signif. codes: 0 '***' 0.001 '**' 0.01 '*' 0.05 '.' 0.1 ' ' 1
The F column reports \(8.44\) and Pr(>F) reports the \(p\)-value of \(0.0005\) — the same numbers as the hand calculation.
An equivalent \(R^2\) form. Stock & Watson write the same statistic in terms of fit rather than SSE: \[
F = \frac{(R^2_U - R^2_R)/J}{(1-R^2_U)/(N-K)} .
\] This gives the identical number — it just computes the cost of the restrictions from the \(R^2\)’s of the two models instead of their sums of squared errors.
17.3 Overall significance and the t–F link
The single most-reported \(F\)-test asks whether the regressors jointly explain anything at all. The null sets every slope to zero, \[
H_0:\ \beta_2 = \beta_3 = \dots = \beta_K = 0
\qquad\text{(the model is worthless)} .
\] Under this null the restricted model keeps only the intercept, \(y_i = \beta_1 + e_i\), which OLS fits with \(\bar y\). The restricted sum of squared errors is then exactly the total sum of squares, \(\mathrm{SSE}_R = \mathrm{SST}\). With \(J = K-1\) restrictions, the statistic specializes to \[
F = \frac{(\mathrm{SST} - \mathrm{SSE})/(K-1)}{\mathrm{SSE}/(N-K)}
\;\sim\; F_{(K-1,\,N-K)} .
\]
Big Andy's overall F
With \(\mathrm{SST} = 3115.48\), \(\mathrm{SSE} = 1532.08\), and \(K = 4\), \[
F = \frac{(3115.48 - 1532.08)/3}{1532.08/71} = 24.46 \;\gg\; F_c = 2.73 .
\] We reject decisively — at least one of PRICE, ADVERT, ADVERT\(^2\) matters. This is the overall significance\(F\) that statistical software prints on every regression output.
It is exactly the F-statistic line at the bottom of summary():
summary(unrestricted)#> #> Call:#> lm(formula = sales ~ price + advert + I(advert^2), data = andy)#> #> Residuals:#> Min 1Q Median 3Q Max #> -12.2553 -3.1430 -0.0117 2.8513 11.8050 #> #> Coefficients:#> Estimate Std. Error t value Pr(>|t|) #> (Intercept) 109.7190 6.7990 16.137 < 2e-16 ***#> price -7.6400 1.0459 -7.304 3.24e-10 ***#> advert 12.1512 3.5562 3.417 0.00105 ** #> I(advert^2) -2.7680 0.9406 -2.943 0.00439 ** #> ---#> Signif. codes: 0 '***' 0.001 '**' 0.01 '*' 0.05 '.' 0.1 ' ' 1#> #> Residual standard error: 4.645 on 71 degrees of freedom#> Multiple R-squared: 0.5082, Adjusted R-squared: 0.4875 #> F-statistic: 24.46 on 3 and 71 DF, p-value: 5.6e-11
The reported F-statistic: 24.46 on 3 and 71 DF is the overall-significance test, and its tiny \(p\)-value confirms the model explains real variation in sales.
When are \(t\) and \(F\) the same?
For a single restriction the two tests are not rivals — they are the same test in two costumes.
For a single restriction (J = 1), t and F agree
A two-tailed \(t\)-test and the \(F\)-test reach the identical conclusion, because \[
F = t^2 \qquad\text{and}\qquad F_c = t_c^2 .
\] Same \(p\)-value, same verdict.
For Big Andy’s, testing \(H_0:\beta_2 = 0\) (PRICE has no effect) gives a \(t\)-statistic of \(t = -7.30\). Squaring it, \(t^2 = 53.4\), which is exactly the \(F\)-statistic for that single restriction.
But there are two situations where only one of the tools works, and it pays to know which:
One-tailed tests (\(H_1:\beta > c\)): use \(t\). Because \(F = t^2\) squares away the sign of the deviation, the \(F\)-test cannot do a one-sided alternative.
Joint tests (\(J \ge 2\)): use \(F\). There is no single \(t\)-statistic that captures several restrictions at once.
The working rule, then: test single restrictions with \(t\), joint restrictions with \(F\).
17.4 Testing economic restrictions
The real power of the \(F\)-test is that the restrictions can be any linear equalities that economic theory hands us — not just “this coefficient is zero.” Any restriction we can write as a linear equation in the \(\beta\)’s defines a restricted model, and the same \(F\)-statistic applies.
Cobb--Douglas and constant returns to scale
A Cobb–Douglas production function \(Q = A\,L^{\beta_2} K^{\beta_3}\) becomes, in logs, \[
\ln Q = \beta_1 + \beta_2 \ln L + \beta_3 \ln K + e .
\]Constant returns to scale — doubling all inputs doubles output — is exactly the linear restriction \[
H_0:\ \beta_2 + \beta_3 = 1 .
\] Impose it (a restricted model with one fewer free parameter), obtain \(\mathrm{SSE}_R\), and form the \(F\) with \(J = 1\). If the data reject in favor of \(\beta_2 + \beta_3 > 1\), the technology has increasing returns to scale.
Two more examples show how naturally theory translates into restrictions.
No money illusion (HGL beer demand)
A log-log beer-demand model is \[
\ln Q = \beta_1 + \beta_2\ln P_B + \beta_3\ln P_L + \beta_4\ln P_R
+ \beta_5\ln I + e ,
\] with the prices of beer, liquor, and remaining goods, plus income. Scaling all prices and income by the same factor should leave quantity demanded unchanged — there is no money illusion — which is the restriction \[
H_0:\ \beta_2 + \beta_3 + \beta_4 + \beta_5 = 0 .
\]
Is $1{,}900 the optimal ad spend?
In Big Andy’s quadratic model, the advertising optimum satisfies \(\beta_3 + 2\beta_4\,\text{ADVERT} = 1\). Evaluated at \(\text{ADVERT} = 1.9\) (i.e. $1{,}900), this is the single restriction \[
H_0:\ \beta_3 + 3.8\,\beta_4 = 1 .
\] The test gives \(F = 0.94 < 3.98\), so we fail to reject: $1{,}900 is compatible with the data.
In practice there are two equivalent ways to get \(\mathrm{SSE}_R\). You can rewrite the model to embed the restriction and re-estimate it, or you can hand the restriction directly to software, which computes the \(F\) (a Wald test) and its \(p\)-value for you. To embed the optimal-ad restriction by hand, solve it for \(\beta_3 = 1 - 3.8\,\beta_4\) and substitute, which moves the \(\text{ADVERT}\) term to the left and leaves one fewer coefficient to estimate:
# H0: beta3 + 3.8*beta4 = 1 => substitute beta3 = 1 - 3.8*beta4.# Moving the ADVERT term to the left changes the response, so we compute the# F-statistic directly from the two sums of squared errors.restricted_ad<-lm(I(sales-advert)~price+I(advert^2-3.8*advert), data =andy)sse_R<-sum(resid(restricted_ad)^2)# restricted: 1 fewer free coefficientsse_U<-sum(resid(unrestricted)^2)J<-1; N<-nobs(unrestricted); K<-length(coef(unrestricted))F_stat<-((sse_R-sse_U)/J)/(sse_U/(N-K))c(F =F_stat, p_value =pf(F_stat, J, N-K, lower.tail =FALSE))#> F p_value #> 0.9361953 0.3365427
The \(F\)-statistic of \(0.94\) (with \(p = 0.34\)) confirms the hand result: the data have no quarrel with $1{,}900 being optimal.
Bundling several conjectures
Nothing stops a single \(H_0\) from bundling different economic claims together. Suppose Andy plans staffing on two assumptions at once: that $1{,}900 is the optimal ad spend, and that sales at PRICE \(= 6\), ADVERT \(= 1.9\) average $80{,}000. Written out, the joint null is \[
H_0:\ \beta_3 + 3.8\,\beta_4 = 1
\quad\text{and}\quad
\beta_1 + 6\beta_2 + 1.9\beta_3 + 3.61\beta_4 = 80 .
\] With two restrictions (\(J = 2\)) this must be an \(F\)-test — no \(t\) can do it. Here \(F = 5.74\) with \(p = 0.005\), so we reject: the two plans are jointly incompatible with the data, even though each one alone might survive on its own.
This is the everyday use of \(F\)-tests in research — bundling a model’s theoretical restrictions together and asking whether the data can live with all of them at once. A set of assumptions that each looks fine individually can still be collectively untenable.
17.5 Recap
The \(F\)-test evaluates a joint null of \(J \ge 2\) restrictions in a single statistic — something a collection of \(t\)-tests cannot do reliably. It compares a restricted and an unrestricted model through \[
F = \frac{(\mathrm{SSE}_R - \mathrm{SSE}_U)/J}{\mathrm{SSE}_U/(N-K)}
\;\sim\; F_{(J,\,N-K)} ,
\] rejecting when the restrictions cause a large jump in SSE. For Big Andy’s advertising terms, \(F = 8.44\) rejects.
The four faces of the \(F\)-test.
Use of the \(F\)-test
Null
Big Andy’s result
Subset of slopes
\(\beta_3 = \beta_4 = 0\)
\(F = 8.44\), reject
Overall significance
all slopes \(= 0\) (restricted model is \(\bar y\))
\(F = 24.46\), reject
Economic restriction
\(\beta_3 + 3.8\beta_4 = 1\)
\(F = 0.94\), fail to reject
Bundled restrictions
optimal ad and mean sales
\(F = 5.74\), reject
On the relationship with the \(t\)-test: for a single restriction (\(J = 1\)) the two agree exactly, since \(F = t^2\) and \(F_c = t_c^2\) (PRICE: \(t = -7.30\), \(t^2 = 53.4 = F\)). But one-tailed alternatives need \(t\) (the squaring in \(F\) discards the sign), and joint nulls need \(F\) (there is no single \(t\)). Finally, the restrictions need not be “\(=0\)”: constant returns to scale (\(\beta_2 + \beta_3 = 1\)), no money illusion (\(\sum \beta = 0\)), and an optimal ad spend (\(\beta_3 + 3.8\beta_4 = 1\)) are all just linear equalities the \(F\)-test handles in stride.
Next time: the \(F\)-test assumed we already had the right model. But choosing that model is the hard part — model specification weighs omitted-variable bias against irrelevant variables, and introduces adjusted \(R^2\), AIC/BIC, the RESET test, and residual diagnostics for deciding which variables belong.
Source Code
---title: "F-Tests & Joint Hypothesis Testing"---{{< include _setup.qmd >}}> **Reading.** Hill, Griffiths & Lim (5th ed.), sec. 6.1--6.2; Stock & Watson (4th ed.), sec. 7.2.The $t$-test we have used so far handles a **single** restriction --- one "equals"sign, even one that spans several coefficients. But many of the questions weactually want to ask are **joint**: they impose two or more restrictions atonce. Does advertising matter *at all* --- is $\beta_3 = 0$ **and** $\beta_4 = 0$in Big Andy's quadratic sales model? Does a *whole group* of variables(socioeconomic controls, prices of substitutes) belong? Does the model explain*anything* --- are **all** the slopes zero? Each of these has *several* equalssigns, and a $t$-test cannot do them. Testing one restriction at a time isunreliable. The tool for the job is the **$F$-test**.This chapter builds the $F$-test from the idea of comparing two nested models ---one with the restrictions imposed and one without. We use it to test overallmodel significance, work out exactly when the $t$- and $F$-tests agree, andfinally turn it loose on *economic* restrictions like constant returns to scale.It builds directly on the multiple-regression machinery and single-coefficienttests of [multiple-regression hypothesis testing](15-mr-hypothesis-testing.qmd).## Why a new test? {#sec-why}A **joint hypothesis** imposes $J \ge 2$ restrictions simultaneously. A typicalexample in Big Andy's model is$$H_0:\ \beta_3 = 0 \ \text{ and } \ \beta_4 = 0\qquad\text{vs.}\qquadH_1:\ \beta_3 \neq 0 \ \text{ or } \ \beta_4 \neq 0 .$$Notice the asymmetry: the null requires *both* coefficients to be zero, while thealternative needs only *one* of them to be nonzero.The natural temptation is to just run two separate $t$-tests, one for eachcoefficient, and combine the verdicts. This is a trap.::: {.warningbox title="Why two t-tests are not a joint test"}- **Error rates compound.** Two separate $5\%$ tests do not deliver a $5\%$ joint test. The chance of *some* false rejection across the two is larger than $5\%$, so the combined procedure has the wrong size.- **It misreads correlated regressors.** When two regressors are collinear, *each* individual $t$ can come out insignificant while the pair is jointly decisive. A one-at-a-time procedure would wrongly drop *both*, throwing away variables that genuinely belong.:::We need a test that weighs *all* the restrictions together, in a singlestatistic with a single $p$-value. That is the $F$-test.## The F-statistic: restricted vs. unrestricted {#sec-fstat}The $F$-test compares the fit of two **nested** models: an unrestricted (full)model, and a restricted model obtained by imposing $H_0$.::: {.keyidea title="Two models, with and without the restrictions"}Take Big Andy's quadratic sales model. The **unrestricted** model is the fullspecification,$$\text{SALES} = \beta_1 + \beta_2\text{PRICE} + \beta_3\text{ADVERT} + \beta_4\text{ADVERT}^2 + e ,$$with sum of squared errors $\mathrm{SSE}_U$. The **restricted** model imposes$H_0:\beta_3 = \beta_4 = 0$, dropping both advertising terms,$$\text{SALES} = \beta_1 + \beta_2\text{PRICE} + e ,$$with sum of squared errors $\mathrm{SSE}_R$.:::Dropping variables can only *worsen* the fit --- OLS on the full model is free toset those coefficients to zero if that is best, so allowing them to be nonzerocan never increase the squared-error total. Hence$$\mathrm{SSE}_R \ge \mathrm{SSE}_U \quad\text{always.}$$The whole question is whether the **increase** in SSE from imposing $H_0$ is*large* or *small*. A large increase means the restrictions hurt the fit a lot ---the dropped variables mattered --- so we **reject** $H_0$. A small increase meansthe restrictions were nearly harmless, and we **do not reject**.The $F$-statistic turns "how big is the increase?" into a number with a knowndistribution.::: {.definition title="The F-statistic"}$$F = \frac{(\mathrm{SSE}_R - \mathrm{SSE}_U)/J}{\mathrm{SSE}_U/(N-K)}\;\sim\; F_{(J,\,N-K)} \quad\text{under } H_0 ,$$where $J$ is the number of restrictions (the numerator degrees of freedom) and$N-K$ is the unrestricted model's degrees of freedom (the denominator degrees offreedom).:::Reading the pieces: the **numerator** is the *extra* error caused by imposing$H_0$, expressed per restriction. The **denominator** is the model's own noise,$\hat\sigma^2 = \mathrm{SSE}_U/(N-K)$. So $F$ measures the cost of therestrictions *relative to* the model's underlying variability. A **large** $F$means the restrictions cost a lot relative to noise, and we **reject** $H_0$when $F \ge F_c$, the critical value. Because only large values count against$H_0$, the $F$-test is always a **right-tailed** test (@fig-fdist).```{r}#| label: fig-fdist#| fig-cap: "The F-distribution. We reject $H_0$ for large $F$, in the right tail beyond the critical value $F_c$."#| fig-width: 5#| fig-height: 3.4xs <-seq(0.001, 6, length.out =400)df1 <-2; df2 <-71Fc <-qf(0.95, df1, df2)dat <-data.frame(x = xs, y =df(xs, df1, df2))sh <-subset(dat, x >= Fc)ggplot(dat, aes(x, y)) +geom_area(data = sh, aes(x, y), fill = ucla$red, alpha =0.30) +geom_line(color = ucla$darkblue, linewidth =1) +geom_segment(aes(x = Fc, xend = Fc, y =0, yend =df(Fc, df1, df2)),linetype ="dashed", color = ucla$gray) +annotate("text", x = Fc +1.1, y =0.05, label ="reject",color = ucla$red, size =3.4) +scale_x_continuous(breaks = Fc, labels =expression(F[c])) +scale_y_continuous(limits =c(0, 0.75)) +labs(x ="F", y ="density")```### Big Andy's: does advertising matter?Put the test to work. We test $H_0:\beta_3 = 0,\ \beta_4 = 0$ --- advertising,both its linear and quadratic terms, is irrelevant --- against "at least onenonzero." Here $J = 2$ restrictions, $N = 75$ observations, and $K = 4$coefficients in the full model. The two sums of squared errors are$$\mathrm{SSE}_U = 1532.08, \qquad \mathrm{SSE}_R = 1896.39 ,$$so the statistic is$$F = \frac{(1896.39 - 1532.08)/2}{1532.08/(75-4)} = 8.44 .$$The $5\%$ critical value is $F_{(0.95,\,2,\,71)} = 3.13$, and the $p$-value is$0.0005$. Since $8.44 > 3.13$ we **reject $H_0$**: advertising does affect sales.Crucially, we could *not* have learned this cleanly from the two separate $t$'s,because ADVERT and ADVERT$^2$ are collinear --- exactly the situation the jointtest is built for.In R, the entire calculation is one `anova()` call comparing the restricted andunrestricted fits.```{r}#| code-fold: falsedata(andy)unrestricted <-lm(sales ~ price + advert +I(advert^2), data = andy)restricted <-lm(sales ~ price, data = andy)anova(restricted, unrestricted)```The `F` column reports $8.44$ and `Pr(>F)` reports the $p$-value of $0.0005$ ---the same numbers as the hand calculation.::: {.callout-note appearance="simple"}**An equivalent $R^2$ form.** Stock & Watson write the same statistic in terms offit rather than SSE:$$F = \frac{(R^2_U - R^2_R)/J}{(1-R^2_U)/(N-K)} .$$This gives the identical number --- it just computes the cost of the restrictionsfrom the $R^2$'s of the two models instead of their sums of squared errors.:::## Overall significance and the t--F link {#sec-overall}The single most-reported $F$-test asks whether the regressors *jointly* explainanything at all. The null sets **every** slope to zero,$$H_0:\ \beta_2 = \beta_3 = \dots = \beta_K = 0\qquad\text{(the model is worthless)} .$$Under this null the restricted model keeps only the intercept,$y_i = \beta_1 + e_i$, which OLS fits with $\bar y$. The restricted sum ofsquared errors is then exactly the total sum of squares, $\mathrm{SSE}_R =\mathrm{SST}$. With $J = K-1$ restrictions, the statistic specializes to$$F = \frac{(\mathrm{SST} - \mathrm{SSE})/(K-1)}{\mathrm{SSE}/(N-K)}\;\sim\; F_{(K-1,\,N-K)} .$$::: {.example title="Big Andy's overall F"}With $\mathrm{SST} = 3115.48$, $\mathrm{SSE} = 1532.08$, and $K = 4$,$$F = \frac{(3115.48 - 1532.08)/3}{1532.08/71} = 24.46 \;\gg\; F_c = 2.73 .$$We reject decisively --- at least one of PRICE, ADVERT, ADVERT$^2$ matters. This isthe **overall significance** $F$ that statistical software prints on everyregression output.:::It is exactly the `F-statistic` line at the bottom of `summary()`:```{r}#| code-fold: falsesummary(unrestricted)```The reported `F-statistic: 24.46 on 3 and 71 DF` is the overall-significancetest, and its tiny $p$-value confirms the model explains real variation in sales.### When are $t$ and $F$ the same?For a single restriction the two tests are not rivals --- they are the same test intwo costumes.::: {.property title="For a single restriction (J = 1), t and F agree"}A two-tailed $t$-test and the $F$-test reach the **identical** conclusion,because$$F = t^2 \qquad\text{and}\qquad F_c = t_c^2 .$$Same $p$-value, same verdict.:::For Big Andy's, testing $H_0:\beta_2 = 0$ (PRICE has no effect) gives a$t$-statistic of $t = -7.30$. Squaring it, $t^2 = 53.4$, which is exactly the$F$-statistic for that single restriction.But there are two situations where only one of the tools works, and it pays toknow which:- **One-tailed tests** ($H_1:\beta > c$): use $t$. Because $F = t^2$ squares away the sign of the deviation, the $F$-test *cannot* do a one-sided alternative.- **Joint tests** ($J \ge 2$): use $F$. There is no single $t$-statistic that captures several restrictions at once.The working rule, then: **test single restrictions with $t$, joint restrictionswith $F$.**## Testing economic restrictions {#sec-restrictions}The real power of the $F$-test is that the restrictions can be *any* linearequalities that economic theory hands us --- not just "this coefficient is zero."Any restriction we can write as a linear equation in the $\beta$'s defines arestricted model, and the same $F$-statistic applies.::: {.keyidea title="Cobb--Douglas and constant returns to scale"}A Cobb--Douglas production function $Q = A\,L^{\beta_2} K^{\beta_3}$ becomes, inlogs,$$\ln Q = \beta_1 + \beta_2 \ln L + \beta_3 \ln K + e .$$**Constant returns to scale** --- doubling all inputs doubles output --- is exactlythe linear restriction$$H_0:\ \beta_2 + \beta_3 = 1 .$$Impose it (a restricted model with one fewer free parameter), obtain$\mathrm{SSE}_R$, and form the $F$ with $J = 1$. If the data reject in favor of$\beta_2 + \beta_3 > 1$, the technology has *increasing* returns to scale.:::Two more examples show how naturally theory translates into restrictions.::: {.example title="No money illusion (HGL beer demand)"}A log-log beer-demand model is$$\ln Q = \beta_1 + \beta_2\ln P_B + \beta_3\ln P_L + \beta_4\ln P_R + \beta_5\ln I + e ,$$with the prices of beer, liquor, and remaining goods, plus income. Scaling allprices *and* income by the same factor should leave quantity demanded unchanged--- there is **no money illusion** --- which is the restriction$$H_0:\ \beta_2 + \beta_3 + \beta_4 + \beta_5 = 0 .$$:::::: {.example title="Is \$1{,}900 the optimal ad spend?"}In Big Andy's quadratic model, the advertising optimum satisfies$\beta_3 + 2\beta_4\,\text{ADVERT} = 1$. Evaluated at $\text{ADVERT} = 1.9$(i.e. \$1{,}900), this is the single restriction$$H_0:\ \beta_3 + 3.8\,\beta_4 = 1 .$$The test gives $F = 0.94 < 3.98$, so we **fail to reject**: \$1{,}900 iscompatible with the data.:::In practice there are two equivalent ways to get $\mathrm{SSE}_R$. You can**rewrite the model to embed the restriction** and re-estimate it, or you canhand the restriction directly to software, which computes the $F$ (a **Waldtest**) and its $p$-value for you. To embed the optimal-ad restriction by hand,solve it for $\beta_3 = 1 - 3.8\,\beta_4$ and substitute, which moves the$\text{ADVERT}$ term to the left and leaves one fewer coefficient to estimate:```{r}#| code-fold: false# H0: beta3 + 3.8*beta4 = 1 => substitute beta3 = 1 - 3.8*beta4.# Moving the ADVERT term to the left changes the response, so we compute the# F-statistic directly from the two sums of squared errors.restricted_ad <-lm(I(sales - advert) ~ price +I(advert^2-3.8* advert),data = andy)sse_R <-sum(resid(restricted_ad)^2) # restricted: 1 fewer free coefficientsse_U <-sum(resid(unrestricted)^2)J <-1; N <-nobs(unrestricted); K <-length(coef(unrestricted))F_stat <- ((sse_R - sse_U) / J) / (sse_U / (N - K))c(F = F_stat, p_value =pf(F_stat, J, N - K, lower.tail =FALSE))```The $F$-statistic of $0.94$ (with $p = 0.34$) confirms the hand result: the datahave no quarrel with \$1{,}900 being optimal.### Bundling several conjecturesNothing stops a single $H_0$ from bundling *different* economic claims together.Suppose Andy plans staffing on two assumptions at once: that \$1{,}900 is theoptimal ad spend, **and** that sales at PRICE $= 6$, ADVERT $= 1.9$ average\$80{,}000. Written out, the joint null is$$H_0:\ \beta_3 + 3.8\,\beta_4 = 1\quad\text{and}\quad\beta_1 + 6\beta_2 + 1.9\beta_3 + 3.61\beta_4 = 80 .$$With two restrictions ($J = 2$) this *must* be an $F$-test --- no $t$ can do it.Here $F = 5.74$ with $p = 0.005$, so we **reject**: the two plans are *jointly*incompatible with the data, even though each one alone might survive on its own.::: {.callout-note appearance="simple"}This is the everyday use of $F$-tests in research --- bundling a model'stheoretical restrictions together and asking whether the data can live with allof them at once. A set of assumptions that each looks fine individually can stillbe collectively untenable.:::## Recap {#sec-recap}The **$F$-test** evaluates a joint null of $J \ge 2$ restrictions in a singlestatistic --- something a collection of $t$-tests cannot do reliably. It compares arestricted and an unrestricted model through$$F = \frac{(\mathrm{SSE}_R - \mathrm{SSE}_U)/J}{\mathrm{SSE}_U/(N-K)}\;\sim\; F_{(J,\,N-K)} ,$$rejecting when the restrictions cause a *large* jump in SSE. For Big Andy'sadvertising terms, $F = 8.44$ rejects.| Use of the $F$-test | Null | Big Andy's result ||---|---|---|| Subset of slopes | $\beta_3 = \beta_4 = 0$ | $F = 8.44$, reject || Overall significance | all slopes $= 0$ (restricted model is $\bar y$) | $F = 24.46$, reject || Economic restriction | $\beta_3 + 3.8\beta_4 = 1$ | $F = 0.94$, fail to reject || Bundled restrictions | optimal ad *and* mean sales | $F = 5.74$, reject |: The four faces of the $F$-test. {.striped}On the relationship with the $t$-test: for a single restriction ($J = 1$) the twoagree exactly, since $F = t^2$ and $F_c = t_c^2$ (PRICE: $t = -7.30$, $t^2 =53.4 = F$). But one-tailed alternatives need $t$ (the squaring in $F$ discards thesign), and joint nulls need $F$ (there is no single $t$). Finally, therestrictions need not be "$=0$": constant returns to scale ($\beta_2 + \beta_3 =1$), no money illusion ($\sum \beta = 0$), and an optimal ad spend($\beta_3 + 3.8\beta_4 = 1$) are all just linear equalities the $F$-test handlesin stride.**Next time:** the $F$-test assumed we already had the right model. But *choosing*that model is the hard part --- [model specification](18-model-specification.qmd)weighs omitted-variable bias against irrelevant variables, and introducesadjusted $R^2$, AIC/BIC, the RESET test, and residual diagnostics for decidingwhich variables belong.